Write Up 11: Polar Equations
Zachary Laughlin
Introduction:
Throughout this write-up, we will be discussing equations in polar form. The difference in a polar equation is that our outputs and inputs are defined differently. We are used to writing our equations with an x-input and a y-output. But in the polar plane, equations are defined with an input value of ![]() - the angle measure swept out from due east, and a output value of r- radius of the circle defined in the plane.
- the angle measure swept out from due east, and a output value of r- radius of the circle defined in the plane.
Investigation 1:
For the first investigation, suppose we are working with the polar equations:
![]()
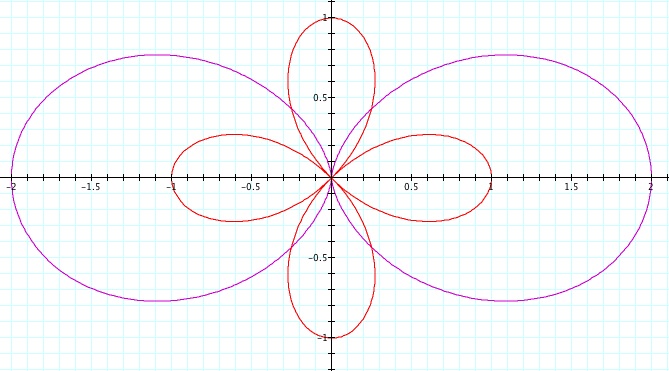
in this investigation, we will keep everything constant except the value of "k." Throughout this first investigation, we will change the value of "k" and see how this variable in the polar equation varies. Therefore, suppose we start with the polar equations below and their graphs:
We can see from the graph above that the added value of 1 makes a big difference in the polar equation. When k=2, the polar equation r=1+cos(2
) represented by the purple graph gives us some sort of bow tie with two connecting egg shaped figures. The other polar equation r=cos(2
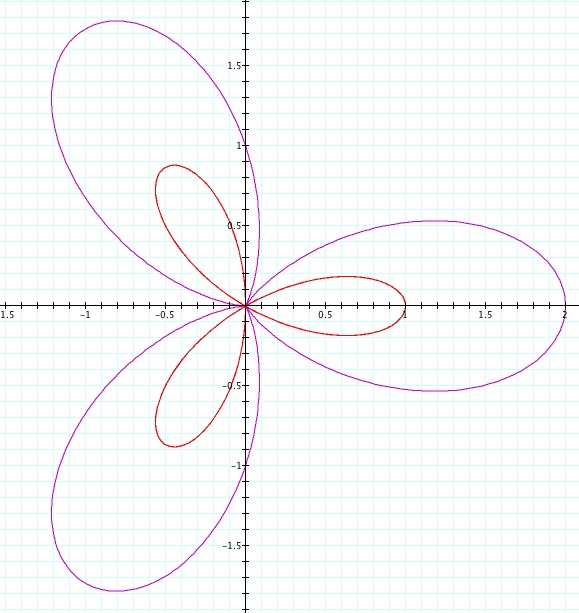
What if "k" is odd? Lets say k=3:
When k=3, the two graph looks very similar. The graph of r=1+cos(3
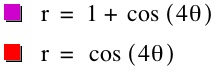
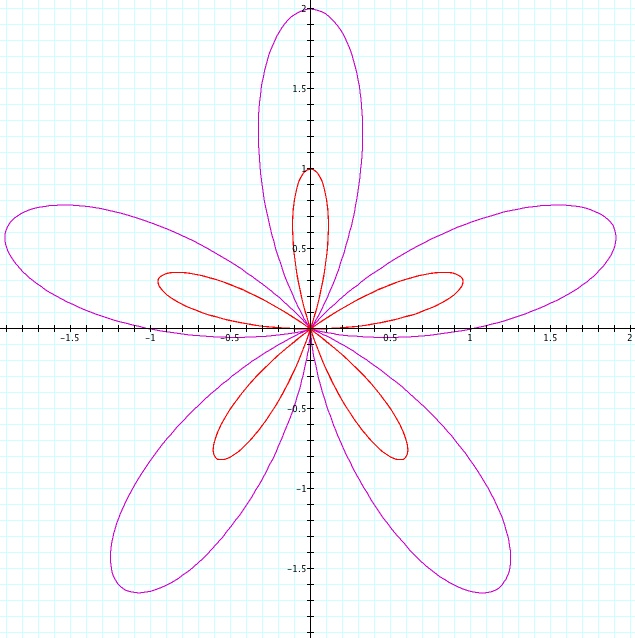
Suppose k=4:
When k=4, the polar equation r=1+cos(4
) produces a four-leaf clover with its' minimum and maximums reaching 2 and -2 on the x & y axes. Our other equation r=cos(4
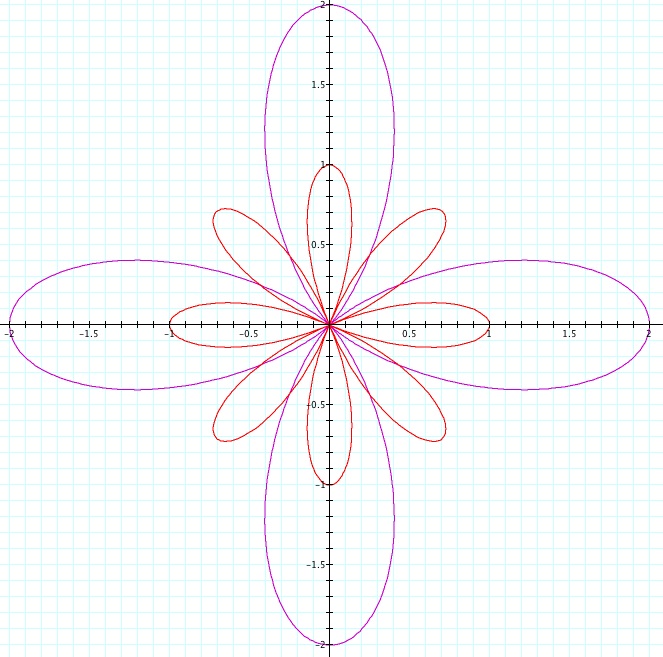
Suppose k=5:
The trend also continues for odd values of k. The orientation of both graphs are congruent. Both graphs contain 5 cloves all connecting at the origin of the plane. Again, the added value of 1 in the equation r=1+cos(5
Investigation 2:
What happens when we replace "cos" with "sin":
Suppose we now have the equations:
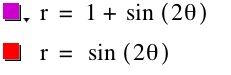
When we change our trig function from "cos" to "sin," our graph rotates 45 degrees or π/4 in radians. This rotation of 45 degrees stays consistent with any value of "k," odd or even. Above we see the graph of the sin functions when k=2. Now let's see the graphs when k=3,4,5:
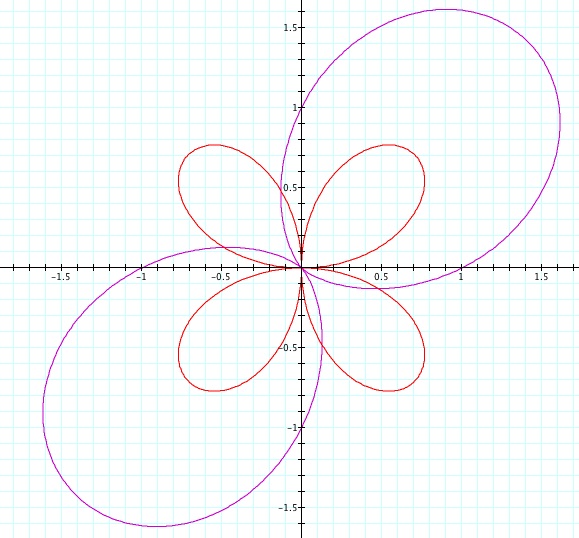
Graph of sin functions when k=3:
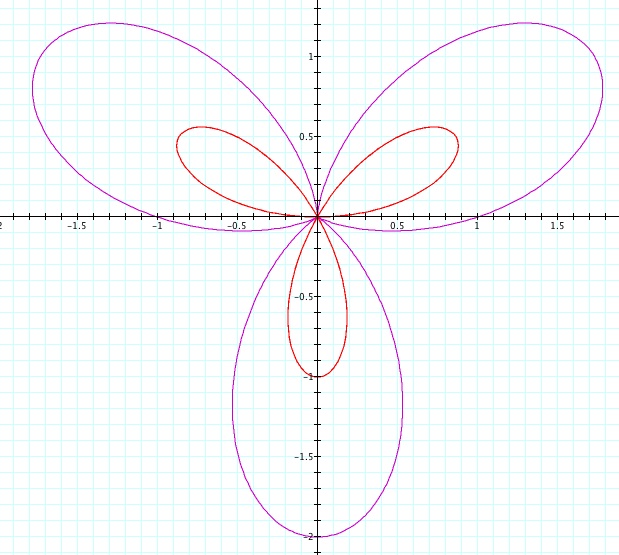
Graph of sin functions when k=4:
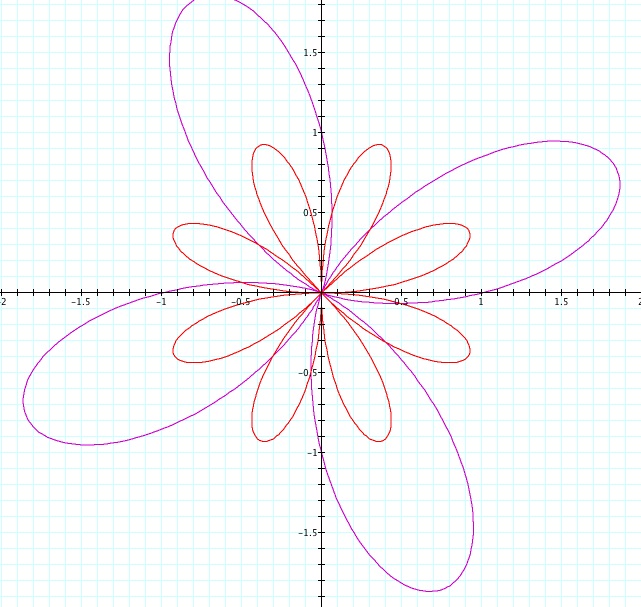
Graph of sin functions when k=5:
Hence, the number of clovers stays consistent with the earlier graphs of cos functions, but the two things that did not stay consistent when switching to sin functions was the rotation of the figure by 45 degrees and the axes of symmetry change.